Image Details
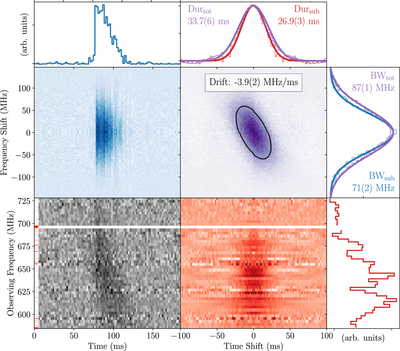
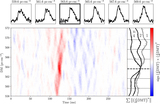
Caption: Figure 5.
Autocorrelations of the burst emission region. Bottom left (gray): the dedispersed dynamic spectrum with a frequency resolution of ∼3 MHz and time resolution of ∼3 ms (corrected for the effective bandpass). Bottom right (red): the 1D autocorrelation of every time series shows the characteristic width of the subbursts for different frequencies. Top left (blue): the 1D autocorrelation of every spectrum shows the characteristic subburst bandwidth for different times. Top right (purple): the 2D autocorrelation shows the self-similarity of the burst and the subburst drift rate, obtained by fitting a 2D Gaussian (FWHM indicated in black). Summed autocorrelations, with colors corresponding to the images, are shown in the panels on top and at the right. Note that structure in the projected 1D time autocorrelation is largely instrumental.
Other Images in This Article
Copyright and Terms & Conditions
© 2019. The American Astronomical Society. All rights reserved.