Image Details
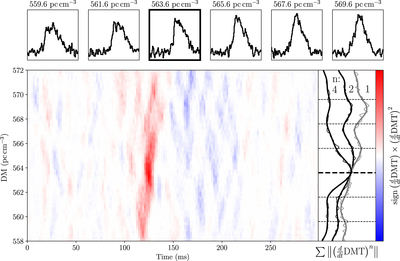
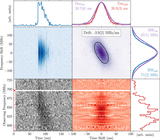
Caption: Figure 4.
Structure-optimizing DM method. The main panel shows the signed square (n = 2) of the forward time derivative of the smoothed DM transform (DMT), where the color scale reflects the local steepness of frequency-averaged burst profiles for different DMs. While absolute values are taken for the final metric, we show the sign to highlight rising and falling regions. Likewise, we show n = 2 to highlight structure beyond a singular sharp rise. The curves in the right panel are high-order polynomial fits to time-averaged time derivatives to the power n, normalized to DM 563.6 pc cm−3. Dashed lines correspond to the DMs used to produce the six frequency-averaged burst profiles at the top, with the structure-optimizing DM indicated in bold. Note that the profiles have been convolved with a 3 ms boxcar to match the smoothing used on the DM transform prior to taking the time derivative.
Other Images in This Article
Copyright and Terms & Conditions
© 2019. The American Astronomical Society. All rights reserved.