Image Details
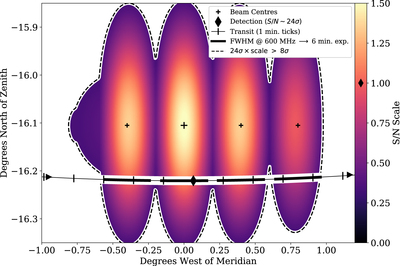
Caption: Figure 2.
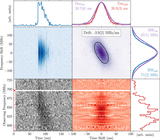
Detection location and transit sensitivity for FRB 121102. The color scale reflects sensitivity variation in the four beams relevant for detection. Crosses indicate beam centers, with the largest cross denoting the detection beam center. The true location at the time of burst detection is indicated with a diamond. Protrusions on the left are caused by east–west aliasing of the synthesized beams on the right. The intersection of the transit with the FWHM at 600 MHz for each beam (indicated with thick black lines) is used for exposure calculations.
Other Images in This Article
Copyright and Terms & Conditions
© 2019. The American Astronomical Society. All rights reserved.
Copyright ©
2026 Astronomy Image Explorer. All Rights Reserved.