Image Details
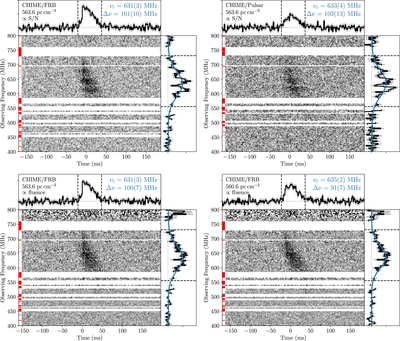
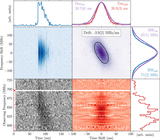
Caption: Figure 3.
Signal intensity as a function of frequency and time (“waterfall”) plot of the CHIME/FRB (upper-left and lower subplots) and CHIME/Pulsar (upper-right subplot) detections of FRB 121102. Data have been dedispersed to the structure-optimizing DM of 563.6 pc cm−3, except for the lower right subplot, which is dedispersed to the nominal 2016 September value of 560.6 pc cm−3 (Spitler et al. 2016). Data plotted here are downsampled to a frequency resolution of ∼3 MHz and a time resolution of ∼2 ms. For the upper subplots, the grayscale reflects S/N of the source dynamic spectrum without explicit bandpass correction. Each channel is independently normalized according to statistics of the off-pulse regions (delineated by vertical dashed lines in top panel). In the lower subplots, bandpass calibration has been applied, and the grayscale reflects fluence. Note that bandpass correction is a work in progress and is complicated by multiple factors—see the text for details. The red lines at the left sides of plots represent radio frequencies masked prior to analysis, while horizontal white stripes show the full extent of frequencies removed after all interference rejection. The right panel is the projected on-pulse spectrum. Strong (order 1) instrumental variations in bandpass are visible in the uncorrected subplots. The blue line is the best single-Gaussian fit to the spectrum (annotated with center frequency and FWHM). The top panel contains the total pulse profile after summing over the frequency channels that bracket the burst (delineated with horizontal dashed lines in the right panel; 550–730 MHz).
Other Images in This Article
Copyright and Terms & Conditions
© 2019. The American Astronomical Society. All rights reserved.