Image Details
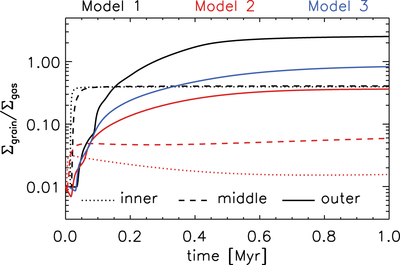
Caption: Figure 7.
Time evolution of dust-to-gas mass ratio Σgrain/Σgas at the peak of the dust rings. The black and red curves show the Σgrain/Σgas values at the peak of dust rings in Models 1 and 2: (dotted) the inner ring at ∼5 au, (dashed) the middle ring at ∼11 au, and (solid) the outer ring at ∼32 au. The blue solid curve shows the Σgrain/Σgas value at the peak of the outer dust ring in Model 3 at ∼29 au.
Other Images in This Article
Copyright and Terms & Conditions
© 2018. The American Astronomical Society. All rights reserved.
Copyright ©
2026 Astronomy Image Explorer. All Rights Reserved.