Image Details
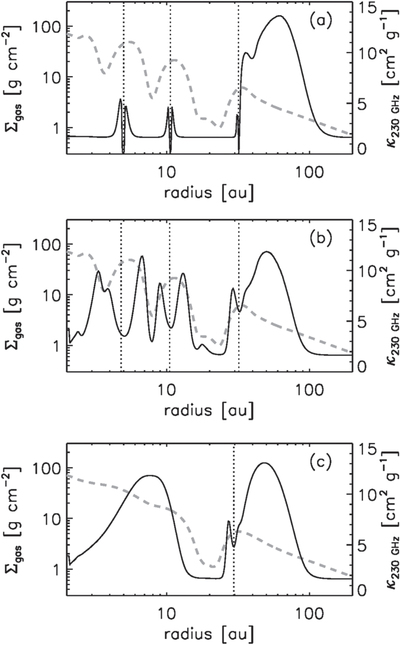
Caption: Figure 5.
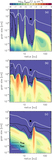
Radial distributions of the gas surface density (gray dashed curves, left y-axis) and the continuum opacity at 230 GHz (black solid curves, right y-axis) for (a) Model 1, (b) Model 2, and (c) Model 3. The vertical dotted lines indicate the radial locations where the total grain surface density has a local maximum. Note the radial variations of the continuum opacity across the disks. We adopt the optical constants from Ricci et al. (2010) to calculate the grain opacity.
Other Images in This Article
Copyright and Terms & Conditions
© 2018. The American Astronomical Society. All rights reserved.
Copyright ©
2026 Astronomy Image Explorer. All Rights Reserved.