Image Details
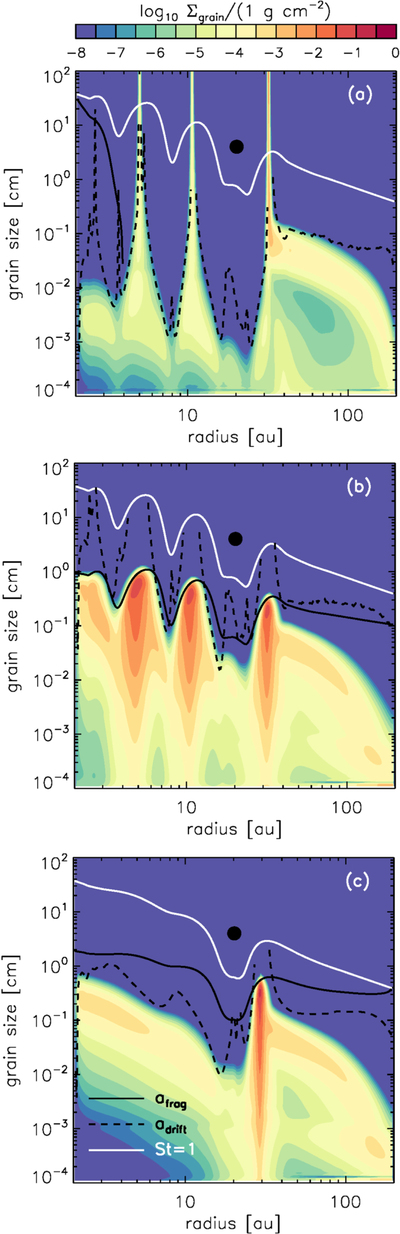
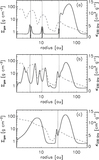
Caption: Figure 4.
Color contours showing the radial distribution of grains with various sizes for (a) Model 1, (b) Model 2, and (c) Model 3. Each horizontal line presents the surface density of the grain (Σgrain) with the size shown on the y-axis. The white curves show the grain size with Stokes number of unity, while black solid and dashed curves present maximum grain sizes under the fragmentation limit (afrag) and the radial drift limit (adrift), respectively, calculated using Equations (1) and (3).
Other Images in This Article
Copyright and Terms & Conditions
© 2018. The American Astronomical Society. All rights reserved.
Copyright ©
2026 Astronomy Image Explorer. All Rights Reserved.