Image Details
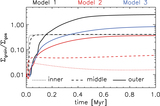
Caption: Figure 3.
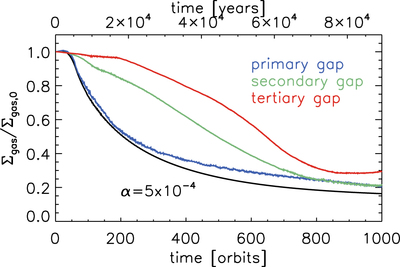
Time evolution of gap depths measured in hydrodynamic simulations, defined as the ratio between the gas surface density at the gap center (Σgas) to the initial surface density at that location (Σgas,0). The color curves show the depth of the three gaps for the α = 5 × 10⁻⁵ model: (blue) the primary gap at 20 au, (green) the secondary gap at ∼8 au, and (red) the tertiary gap at ∼4 au. The black curve shows the depth of the primary gap (at 20 au) for the α = 5 × 10⁻⁴ model.
Other Images in This Article
Copyright and Terms & Conditions
© 2018. The American Astronomical Society. All rights reserved.
Copyright ©
2026 Astronomy Image Explorer. All Rights Reserved.