Image Details
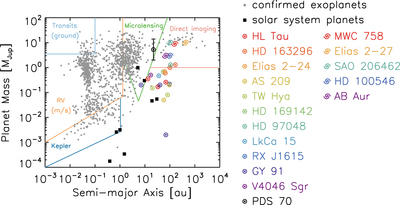
Caption: Figure 1.
Semimajor axis and mass of hypothesized planets assumed to reproduce the observed gaps in protoplanetary disks (⊙ symbols), compiled from the literature: HL Tau (Jin et al. 2016), HD 163296 (Teague et al. 2018), Elias 2–24 (Dipierro et al. 2018), AS 209 (Fedele et al. 2018), TW Hya, HD 169142, HD 97048, LkCa 15, RX J1615 (Dong & Fung 2017a), GY 91 (Sheehan & Eisner 2018), and V4046 Sgr (Ruíz-Rodríguez et al. 2018, in preparation). The predictions are made using either planet–disk interaction simulations (HL Tau, HD 163296, Elias 2–24, AS 209, and V4046 Sgr) or empirical relations between the planet’s mass and gap width (TW Hya, HD 169142, HD 97048, LkCa 15, RX J1615, and GY 91). For the estimations collected from Dong & Fung (2017a), we adopted the masses obtained with a disk viscosity of α = 10−3. Using a factor of 10 larger/smaller disk viscosity would result in about a factor of 3 larger/smaller planet masses (Dong & Fung 2017a). Also shown with spiral symbols are the semimajor axis and mass of hypothesized planets needed to reproduce observed spiral arms, based on planet–disk interaction simulations: MWC 758 (Dong et al. 2015), Elias 2–27 (Meru et al. 2017), SAO 206462 (Bae et al. 2016), HD 100546 (Follette et al. 2017), AB Aur (Dong et al. 2016). In case of AB Aur, both spiral arms and gap are observed (Hashimoto et al. 2011, Tang et al. 2017). Note that some of the disks have directly imaged, confirmed/candidate companions: HD 100546 (Quanz et al. 2013, Currie et al. 2015), LkCa 15 (Sallum et al. 2015), and PDS 70 (Keppler et al. 2018). The error bar on PDS 70 represents the suggested mass range from (Keppler et al. 2018). The gray circles represent confirmed exoplanets as of 2018 May (https://exoplanetarchive.ipac.caltech.edu/). The black squares represent the eight solar system planets. The overplotted lines with color show illustrative estimates of the regions for which various exoplanet detection techniques have discovered exoplanets, similar to the shaded regions in Figure 6 of Gaudi (2012).
Other Images in This Article
Copyright and Terms & Conditions
© 2018. The American Astronomical Society. All rights reserved.