

Image Details
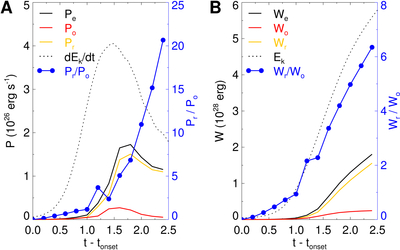
Caption: Figure 7.
Evolution of the upward power and accumulated work associated with the erupting MFR. The time axis is shifted so that t = 0 corresponds to the eruption onset at t = 123.6 in the simulation. (A) The black, red, and orange solid lines represent the upward power associated with the entire erupting MFR, the original component of the erupting MFR, and the reconnected component of the MFR, respectively. The black dashed line shows the growth rate of the total kinetic energy. The blue curve shows the ratio of the upward power of the newly reconnected component to that of the original component. Each circle represents a moment of output data. (B) Same as panel (A), except that the curves represent the accumulated work.
Other Images in This Article
Copyright and Terms & Conditions
© 2026. The Author(s). Published by the American Astronomical Society.

