

Image Details
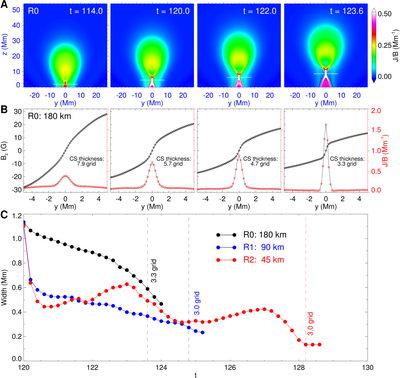
Caption: Figure 5.
Formation and evolution of the core current sheet. (A) Distribution of normalized current J/B on the x = 0 slice in simulation run R0. (B) One-dimensional profile of the magnetic component Bz and normalized current density along the horizontal line perpendicular to the center of the core current sheet (location with the maximum J/B). The diamonds represent the value on the grid nodes. The thin black line is a Gaussian fit of the normalized current density J/B profile, and its FWHM is used to measure the thickness of the current sheet. (C) Temporal evolution of the thickness of the core CS in three simulation runs. Circles indicate individual simulation outputs.
Other Images in This Article
Copyright and Terms & Conditions
© 2026. The Author(s). Published by the American Astronomical Society.

