

Image Details
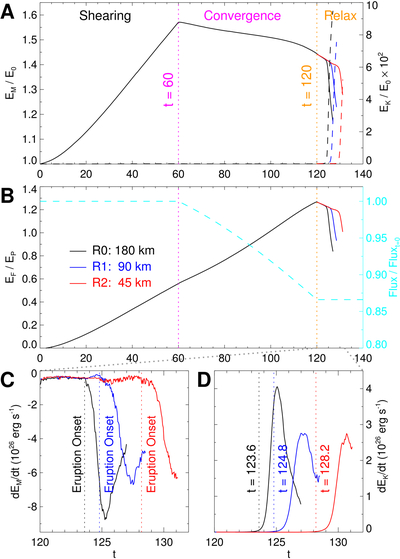
Caption: Figure 3.
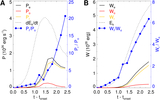
Temporal evolution of magnetic energy, kinetic energy, and magnetic flux. (A) Temporal evolution of the magnetic energy during different driving stages. The black, magenta, and orange shaded regions denote the shearing, converging (flux diffusion), and relaxation stages, respectively. The black, blue, and red solid lines correspond to simulations with the finest grid spacings of 180, 90, and 45 km, respectively, while the dashed lines show the corresponding kinetic energies. The vertical dotted lines mark the transitions between different driving stages. (B) Evolution of the nonpotentiality (EF/EP) and the total unsigned magnetic flux. (C) and (D) Time derivatives of the magnetic and kinetic energies. In panels (A) and (B), EM, EP, EF, E0, and EK refer to the magnetic energy within the system, the potential-field energy (varying with the magnetic flux distribution), the free magnetic energy (magnetic energy minus potential-field energy), the potential-field energy at t = 0, and the kinetic energy, respectively. The initial potential-field energy is E0 = 7.32 × 1029 erg. The vertical dotted lines indicate the eruption onset.
Other Images in This Article
Copyright and Terms & Conditions
© 2026. The Author(s). Published by the American Astronomical Society.

