

Image Details
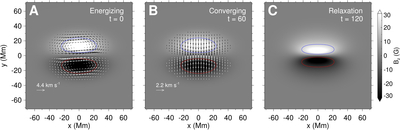
Caption: Figure 1.
Magnetic flux distribution and surface driving flow at the bottom. (A) Initial magnetic flux distribution and the rotational flow. The background is color-coded by the magnetic normal component Bz, and the vectors indicate the imposed rotational flow. The blue and red lines denote one-half of the maximum positive and negative values of the normal magnetic component, respectively. (B) Magnetic flux distribution and the converging flow at t = 60. (C) The magnetic flux distribution at t = 120.
Other Images in This Article
Copyright and Terms & Conditions
© 2026. The Author(s). Published by the American Astronomical Society.

Copyright ©
2026 Astronomy Image Explorer. All Rights Reserved.
