

Image Details
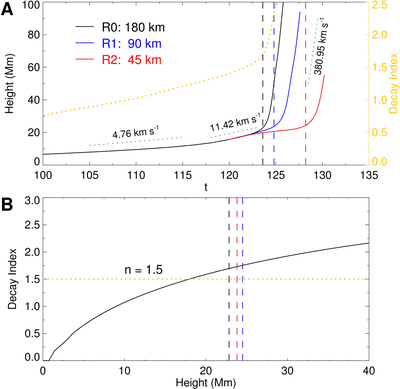
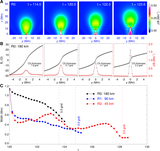
Caption: Figure 4.
Evolution of the MFR axis and the decay index. (A) Apex height (solid lines) of the MFR axis and the decay index (dashed lines) of the strapping field at the apex of the MFR axis. Black, blue, and red correspond to runs R0, R1, and R2, respectively. The vertical dash–dotted lines denote the onset times of the eruptions. (B) Decay index as a function of height. The horizontal dashed line marks the critical decay index value of n = 1.5.
Other Images in This Article
Copyright and Terms & Conditions
© 2026. The Author(s). Published by the American Astronomical Society.

Copyright ©
2026 Astronomy Image Explorer. All Rights Reserved.
