

Image Details
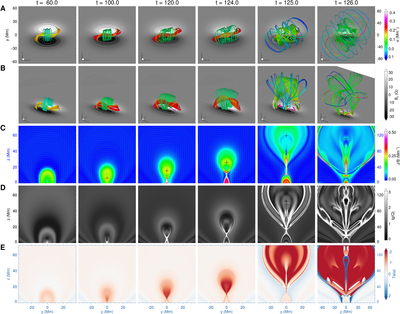
Caption: Figure 2.
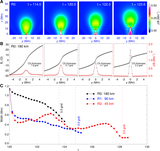
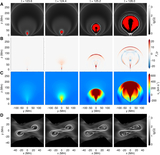
Evolution of magnetic field, normalized current, plasma velocity, magnetic squashing factor Q, and twist in the simulation. (A) Two-dimensional view of selected magnetic field lines. The selected magnetic field lines are colored according to the force-free factor α = J · B/B2. The background shows the magnetic flux distribution on the bottom boundary. (B) 3D perspective view of the same field lines shown in panel (A). (C)–(F) Distributions of the normalized current density J/B, plasma velocity magnitude, magnetic squashing factor Q, and magnetic twist number Tw, respectively, on the central vertical slice. The arrows in panel (C) represent the normalized transverse magnetic field vectors on the slice, revealing a spiral pattern from which the MFR axis is identified and marked by a plus sign. The panels at t = 126 are shown with a larger field of view. An animation of this figure is available. In the animation, panels (A) and (B) are displayed on the left, panel (C) is shown in the upper middle without the normalized transverse magnetic field component, and the plasma velocity distribution on the central vertical slice is shown in the lower middle. Panels (D) and (E) are displayed on the right. The animation shows the sequence from t = 60.0 to 128.0. Its real-time duration is 18 s.
(An animation of this figure is available in the online article.)
(An animation of this figure is available.)
The video/animation of this figure is available in the online journal.
Other Images in This Article
Copyright and Terms & Conditions
© 2026. The Author(s). Published by the American Astronomical Society.

