

Image Details
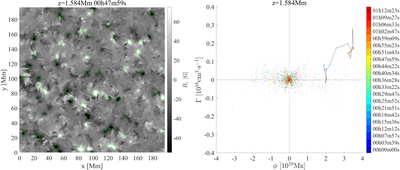
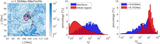
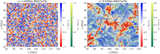
Caption: Figure 8.
Left panel: spatial distribution of ﹩\left|{{\bf{B}}}_{{\bf{z}}}\right|{\boldsymbol{\gt }}{\bf{50}}﹩ G concentrations at z = 1.584 Mm in the full simulation domain. The green contours mark the edges of all concentrations that evolved in the statistical analysis. Right panel: joint distribution of magnetic flux and vorticity flux for all concentrations at all time instants. Different colors of dots represent concentrations at different times, while the circles connected by the black line represent the temporal evolution of the core positive concentration.
Other Images in This Article
Copyright and Terms & Conditions
© 2026. The Author(s). Published by the American Astronomical Society.

Copyright ©
2026 Astronomy Image Explorer. All Rights Reserved.
