

Image Details
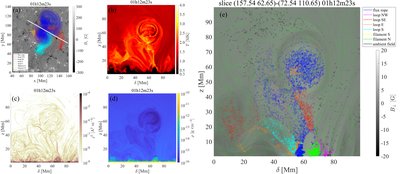
Caption: Figure 4.
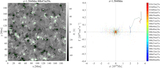
Temporal evolution of the cross section of the flux rope. Panel (a) shows the location of a static vertical slice. Panels (b), (c), and (d) show the distributions of temperature, squared current, and density on the slice, respectively. The horizontal axis of the slice (δ) points from larger x to smaller x. Panel (e) shows the intersections of different CAs with the slice; the gray background represents the magnetic field strength normal to the slice, and the green streamlines represent the magnetic field parallel to the slice. An animation that covers the dynamic evolution of 72 minutes starting from t = t0 is available. The real-time duration is 1.3 s.
(An animation of this figure is available in the online article.)
(An animation of this figure is available.)
The video/animation of this figure is available in the online journal.
Other Images in This Article
Copyright and Terms & Conditions
© 2026. The Author(s). Published by the American Astronomical Society.

