

Image Details
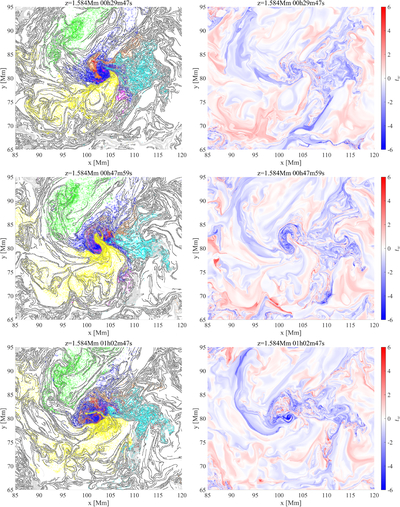
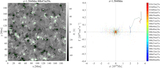
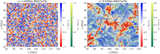
Caption: Figure 6.
Comparison of our clustering method with the Q factor and twist number at three time instants. Left column: gray-filled contours represent regions where Q > 104. The black lines represent the edges of the Q value recognized by the Canny algorithm (J. Canny 1986). The colored markers represent the intersections of all the CAs with the horizontal slice at z = 1.584 Mm; the “o” and “x” markers indicate field lines crossing the slice upward or downward, respectively. Right column: twist number on the same slice. An animation that covers the dynamic evolution of 72 minutes starting from t = t0 is available. The real-time duration is 1.3 s.
(An animation of this figure is available in the online article.)
(An animation of this figure is available.)
The video/animation of this figure is available in the online journal.
Other Images in This Article
Copyright and Terms & Conditions
© 2026. The Author(s). Published by the American Astronomical Society.

