

Image Details
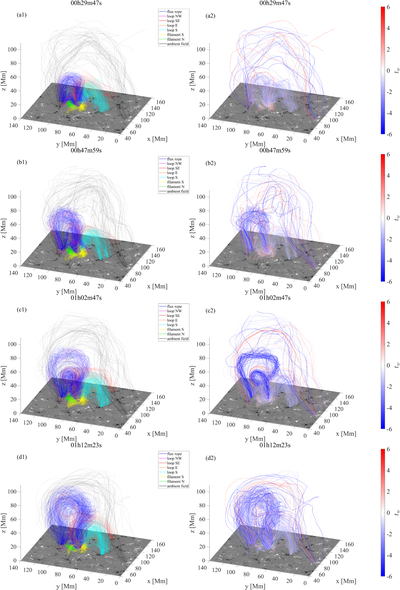
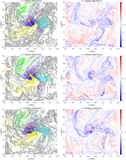
Caption: Figure 2.
Evolution of eight CAs. Left column: different CAs represented by designated colors. Right column: same field lines but colored by the twist number. Rows, top to bottom: (a) initial normal coronal loop; (b) rotating flux rope accumulates twist; (c) unstable flux rope forms a writhe shape; (d) untwisting eruptive flux rope. An animation that covers the dynamic evolution of 72 minutes starting from t = t0 is available. The real-time duration is 1.3 s.
(An animation of this figure is available in the online article.)
(An animation of this figure is available.)
The video/animation of this figure is available in the online journal.
Other Images in This Article
Copyright and Terms & Conditions
© 2026. The Author(s). Published by the American Astronomical Society.

