

Image Details
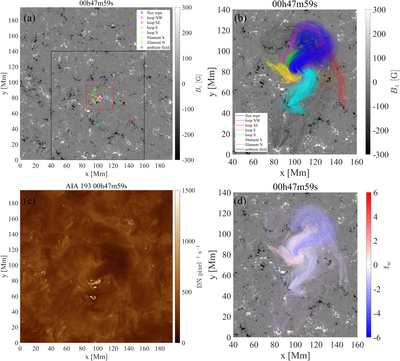
Caption: Figure 1.
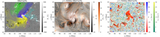
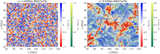
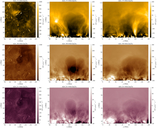
(a) Photospheric magnetogram of the full domain; the colored circles represent the centroids of positive/negative footpoints of different CAs. The yellow solid and dashed lines represent the two types of field lines in filament S. The black rectangle contains the eight identified CAs. The red rectangle includes the positive footpoints of all the CAs except the ambient field. (b) Top view of eight CAs identified by the clustering method. The field of view corresponds to the black rectangle in panel (a). (c) Synthetic EUV image of the full domain in the AIA 193 Å channel. (d) The same field lines as in panel (b) but colored by their twist number. An animation that covers the dynamic evolution of 72 minutes starting from t = t0 is available. The real-time duration is 1.3 s.
(An animation of this figure is available in the online article.)
(An animation of this figure is available.)
The video/animation of this figure is available in the online journal.
Other Images in This Article
Copyright and Terms & Conditions
© 2026. The Author(s). Published by the American Astronomical Society.

