

Image Details
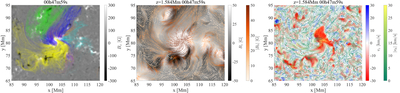
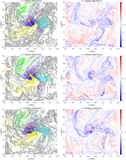
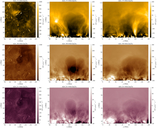
Caption: Figure 5.
Left panel: top view of field lines below 3 Mm for different CAs. The field of view is the same as the red rectangle in panel (a) of Figure 1. Middle panel: magnetic field at z = 1.584 Mm. The gray scale shows the strength of the vertical component of the magnetic field, and the orange streamlines show the direction and strength of the horizontal magnetic field. Right panel: velocity field at the same height, using the same representation for the flow field but with a different color map. An animation that covers the dynamic evolution of 72 minutes starting from t = t0 is available. The real-time duration is 1.3 s.
(An animation of this figure is available in the online article.)
(An animation of this figure is available.)
The video/animation of this figure is available in the online journal.
Other Images in This Article
Copyright and Terms & Conditions
© 2026. The Author(s). Published by the American Astronomical Society.

