

Image Details
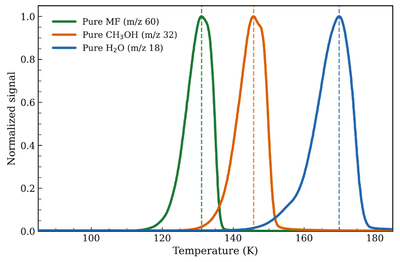
Caption: Figure G1.
Normalized temperature-programmed desorption (TPD) spectra of pure MF (m/z 60), CH3OH (m/z 32), and H2O (m/z 18). Each trace is normalized to its maximum intensity to highlight the relative ordering of desorption temperatures for the three pure ices. Dashed vertical lines indicate the peak desorption temperature for each species.
Other Images in This Article
Show More
Copyright and Terms & Conditions
© 2026. The Author(s). Published by the American Astronomical Society.

Copyright ©
2026 Astronomy Image Explorer. All Rights Reserved.
