

Image Details
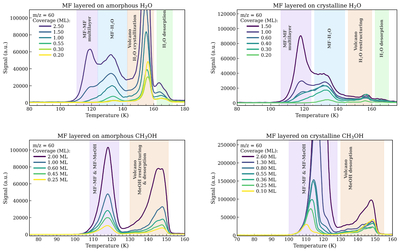
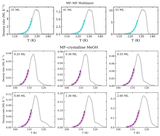
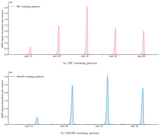
Caption: Figure 5.
Temperature-programmed desorption (TPD) spectra of methyl formate (MF; m/z = 60) for varying initial coverages on amorphous and crystalline H2O (top panels) and CH3OH (bottom panels) substrates. Colored curves indicate different MF coverages in monolayers (ML), as labeled in each panel. Shaded regions mark distinct desorption regimes, including MF multilayer desorption, MF–ice interactions, and higher-temperature desorption associated with substrate restructuring and co-desorption (e.g., volcano desorption and bulk ice release). Differences in peak structure and temperature reflect variations in binding sites, trapping efficiency, and ice morphology between substrates.
Other Images in This Article
Show More
Copyright and Terms & Conditions
© 2026. The Author(s). Published by the American Astronomical Society.

