

Image Details
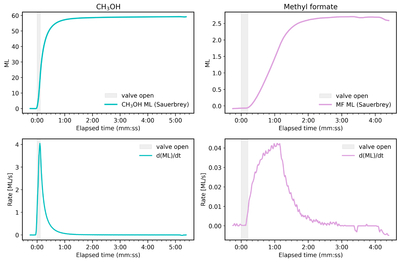
Caption: Figure 2.
Conversion of QCM frequency shifts into surface coverage in monolayers using the Sauerbrey relation. Top panels show cumulative coverage during deposition for methanol (left) and MF (right), plotted on a common time axis for direct comparison, with the valve-open deposition window indicated. Bottom panels show the corresponding deposition rates derived from the time derivative of the smoothed coverage. These measurements establish the absolute coverage scale used for all subsequent TPD experiments.
Other Images in This Article
Show More
Copyright and Terms & Conditions
© 2026. The Author(s). Published by the American Astronomical Society.

Copyright ©
2026 Astronomy Image Explorer. All Rights Reserved.
