

Image Details
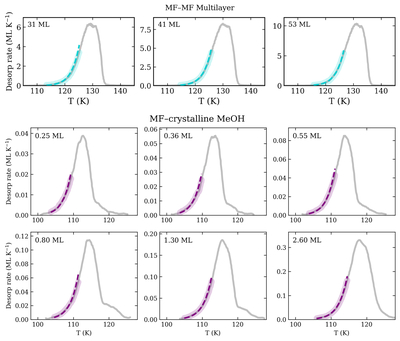
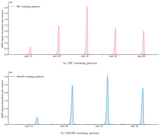
Caption: Figure 4.
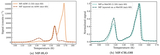
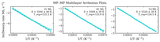
Leading-edge analysis of MF desorption. Top: pure MF multilayer desorption. Bottom: MF deposited on crystalline CH3OH (labeled MeOH in the panels). Gray curves show the calibrated desorption rate, the highlighted regions indicate the leading-edge intervals used for Arrhenius fitting, and the dashed curves show the Arrhenius model using the derived binding energy with the prefactor fixed to ν(Trep). The coverage-independent leading edge observed for MF on crystalline methanol indicates multilayer-like desorption behavior.
Other Images in This Article
Show More
Copyright and Terms & Conditions
© 2026. The Author(s). Published by the American Astronomical Society.

Copyright ©
2026 Astronomy Image Explorer. All Rights Reserved.
