

Image Details
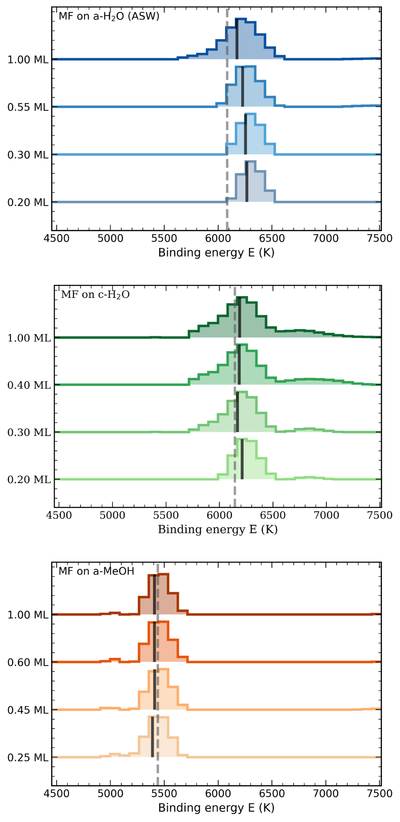
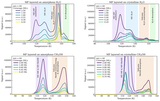
Caption: Figure 3.
Binding-energy distributions of MF derived from NNLS inversion of the TPD spectra. Top: MF on amorphous H2O (ASW). Middle: MF on crystalline H2O. Bottom: MF on amorphous CH3OH. Colored stepped profiles show the recovered NNLS weights as a function of binding energy for the MF coverages labeled at left. Black vertical lines mark the median binding energy of each distribution (defined as the energy at which 50% of the cumulative desorption contribution is reached), while dashed gray vertical lines show the corresponding Redhead binding-energy estimate for MF on each substrate.
Other Images in This Article
Show More
Copyright and Terms & Conditions
© 2026. The Author(s). Published by the American Astronomical Society.

Copyright ©
2026 Astronomy Image Explorer. All Rights Reserved.
