

Image Details
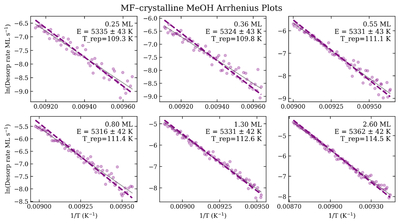
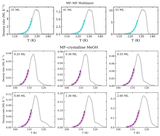
Caption: Figure E2.
Arrhenius plots for MF deposited on crystalline methanol. Points show ﹩\mathrm{ln}{r}_{{\rm{des}}}﹩ (ML s−1) plotted against 1/T for the selected leading-edge intervals. Dashed lines show the corresponding fixed-ν fits, where ν = νTST(Trep).
Other Images in This Article
Show More
Copyright and Terms & Conditions
© 2026. The Author(s). Published by the American Astronomical Society.

Copyright ©
2026 Astronomy Image Explorer. All Rights Reserved.
