

Image Details
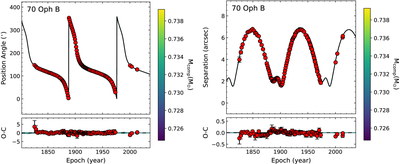
Caption: Figure 3.
The left panel displays the relative position angle vs. time, shown with the maximum-likelihood orbital solution from the joint astrometric and RV fit (black curve). Residuals relative to the best-fit model are shown. The right panel shows relative separation vs. time, again compared with the maximum-likelihood orbital model. Fifty random orbits drawn from the posterior distribution are overplotted, which are colored by companion mass, and they are hidden behind the maximum-likelihood orbit.
Other Images in This Article
Show More
Copyright and Terms & Conditions
© 2026. The Author(s). Published by the American Astronomical Society.

Copyright ©
2026 Astronomy Image Explorer. All Rights Reserved.
