

Image Details
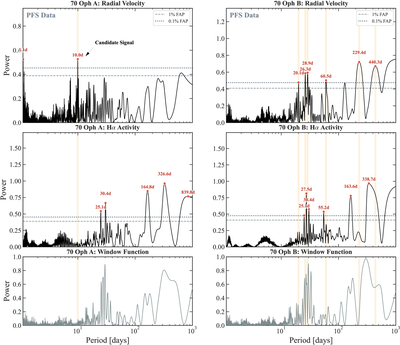
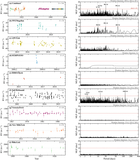
Caption: Figure 5.
GLS periodograms of the nightly binned PFS RVs (top panels), Hα indices (middle panels), and spectral window functions (bottom panels) for 70 Oph A (left) and 70 Oph B (right). Note that the long-period binary orbital trend is not subtracted here. The dark-gray dotted and light-gray dashed horizontal lines mark the 0.1% and 1% FAP levels, respectively. Vertical orange shaded bands indicate significant peaks in the RV periodograms above the 0.1% FAP.
Other Images in This Article
Show More
Copyright and Terms & Conditions
© 2026. The Author(s). Published by the American Astronomical Society.

Copyright ©
2026 Astronomy Image Explorer. All Rights Reserved.
