

Image Details
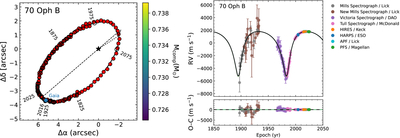
Caption: Figure 2.
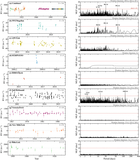
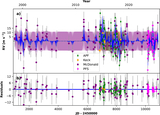
The left panel shows the relative astrometric orbit of 70 Oph B around 70 Oph A. Red points denote archival visual and micrometric measurements from the Washington Double Star Catalog (WDS)/ORB6 catalog, while the solid black curve shows the maximum-likelihood joint orbital solution. 50 orbits color coded by companion mass are randomly drawn from the posterior and plotted, but they are indistinguishable from the black curve because of the tight constraint on the orbit. The dashed line marks the line of nodes, and the star indicates the primary’s position. The right panel shows the RV variation of 70 Oph A measured by eight instruments. Colors correspond to individual RV datasets as indicated in the legend. Residuals relative to the best-fit model are shown.
Other Images in This Article
Show More
Copyright and Terms & Conditions
© 2026. The Author(s). Published by the American Astronomical Society.

