

Image Details
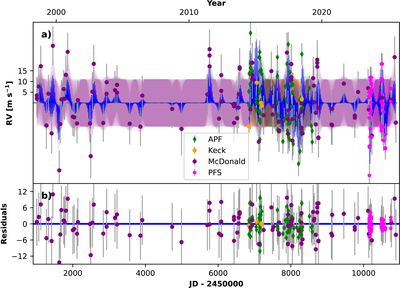
Caption: Figure 10.
QP GP fit to the combined RVs of 70 Oph A. This is the best-fit model. The activity model is fit simultaneously to data from APF (green diamonds), Keck/HIRES (orange circles), McDonald (purple circles), and PFS (magenta pentagons). The shaded region shows the activity predictive mean and 1σ uncertainty. The QP kernel captures rotationally modulated stellar activity with a characteristic period of ∼19.8 days. Panel (a) shows the RV time series and activity model; panel (b) shows the residuals after subtracting the activity model.
Other Images in This Article
Show More
Copyright and Terms & Conditions
© 2026. The Author(s). Published by the American Astronomical Society.

Copyright ©
2026 Astronomy Image Explorer. All Rights Reserved.
