

Image Details
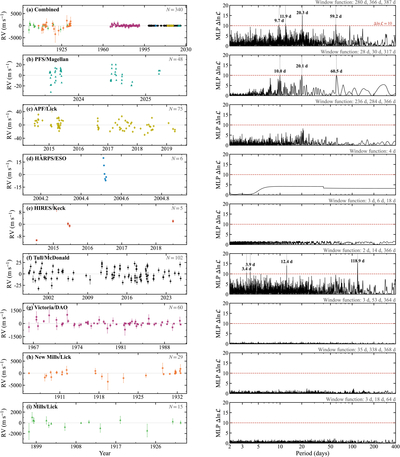
Caption: Figure 6.
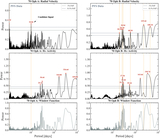
MLPs of the combined and individual 70 Oph A RV residuals after removing the acceleration of 70 Oph B. Per-instrument offsets and jitter are simultaneously fit at each trial frequency. The red dashed line marks the 1% FAP threshold (﹩{\rm{\Delta }}\mathrm{ln}{ \mathcal L }=10﹩). Dominant spectral window peaks are noted above each panel. Gray dotted lines mark signals of interest at 9.7, 11.9, 20.3, and 59.2 days.
Other Images in This Article
Show More
Copyright and Terms & Conditions
© 2026. The Author(s). Published by the American Astronomical Society.

Copyright ©
2026 Astronomy Image Explorer. All Rights Reserved.
