

Image Details
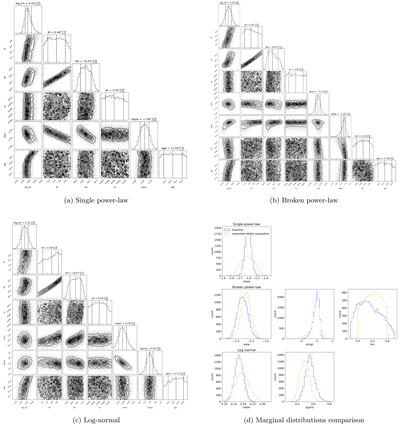
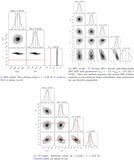
Caption: Figure F1.
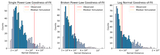
Corner plots of the posterior distributions for the three IMF models, where the IMF and stellar population parameters are fitted simultaneously. Vertical dashed lines mark the 16th, 50th, and 84th percentiles of the marginal distributions. Comparisons of the marginalized distributions of the IMF parameters are shown in the bottom right panel, with the blue histogram showing the posterior from the baseline fit and the orange histogram from the expanded stellar population fit.
Other Images in This Article
Show More
Copyright and Terms & Conditions
© 2026. The Author(s). Published by the American Astronomical Society.

Copyright ©
2026 Astronomy Image Explorer. All Rights Reserved.
