

Image Details
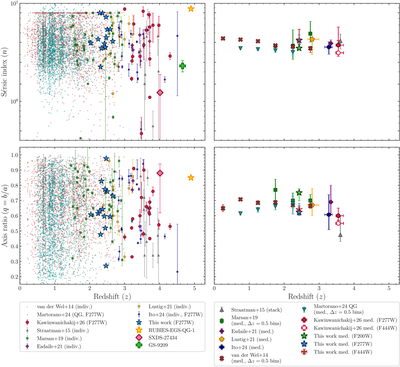
Caption: Figure 12.
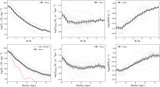
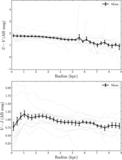
Morphological parameters as a function of redshift for our sample of massive quiescent galaxies (F277W, blue-filled stars) compared with literature values. Top panels: Sérsic index (n) comparison. Bottom panels: axis ratio (q) comparison. Comparison samples include UVJ-selected quiescent galaxies from A. van der Wel et al. (2014; ﹩\mathrm{log}({M}_{* }/{M}_{\odot })\gt 10﹩), C. M. S. Straatman et al. (2015; ﹩10.6\lt \mathrm{log}({M}_{* }/{M}_{\odot })\lt 11.25﹩), and K. Ito et al. (2024; ﹩9.8\lt \mathrm{log}({M}_{* }/{M}_{\odot })\lt 11.4﹩); photometrically selected galaxies from Z. C. Marsan et al. (2019; ﹩\mathrm{log}({M}_{* }/{M}_{\odot })\gt 11.25﹩); and sSFR-selected quiescent galaxies from M. Martorano et al. (2024; ﹩\mathrm{log}({M}_{* }/{M}_{\odot })\gt 10﹩; F277W morphology crossmatched with COSMOS2020 catalog; J. R. Weaver et al. 2022). Individual spectroscopically confirmed massive quiescent galaxies are also shown: SXDS-27434 (M. Tanaka et al. 2019; F. Valentino et al. 2020; K. Ito et al. 2024; ﹩\mathrm{log}({M}_{* }/{M}_{\odot })=11.06﹩), GS-9209 (A. C. Carnall et al. 2023b; ﹩\mathrm{log}({M}_{* }/{M}_{\odot })=10.58﹩), RUBIES-EGS-QG-1 (A. de Graaff et al. 2025; ﹩\mathrm{log}({M}_{* }/{M}_{\odot })=10.9﹩), and galaxies from J. Esdaile et al. (2021; ﹩11\lt \mathrm{log}({M}_{* }/{M}_{\odot })\lt 11.3﹩), P. Lustig et al. (2021; ﹩10.8\lt \mathrm{log}({M}_{* }/{M}_{\odot })\lt 11.3﹩), and L. Kawinwanichakij et al. (2026; ﹩10.2\lt \mathrm{log}({M}_{* }/{M}_{\odot })\lt 11.2﹩). On the right panels, the median Sérsic indices (top) and median axis ratios (bottom) for our sample are shown as blue-filled stars (F277W), brown-outlined stars (F444W), and green-filled stars (F200W). All the median error bars are the 68% confidence intervals derived from bootstrapping for 1000 iterations.
Other Images in This Article
Show More
Copyright and Terms & Conditions
© 2026. The Author(s). Published by the American Astronomical Society.

