

Image Details
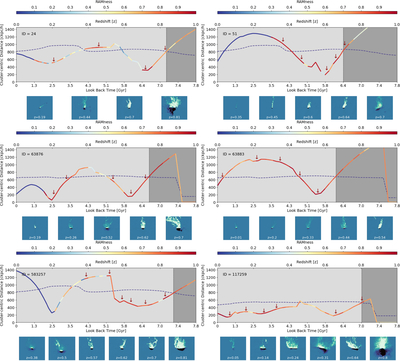
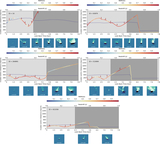
Caption: Figure 9.
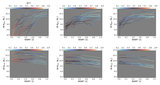
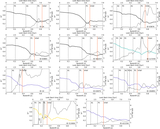
Cluster-centric distance as a function of look-back time of those red subhalos in our sample which have an infall time ≥ 6 Gyr. It is color coded by the ram-ness parameter defined in Equation (5). The dashed curve shows the virial radius R200 of the group. The vertical dotted line marks the the infall time of the subhalo. The bottom panel shows some snapshots of the gas distribution at a specific time (marked by downward arrows in the main panel) where tentacles of gas are clearly seen.
Other Images in This Article
Copyright and Terms & Conditions
© 2026. The Author(s). Published by the American Astronomical Society.

Copyright ©
2026 Astronomy Image Explorer. All Rights Reserved.
