

Image Details
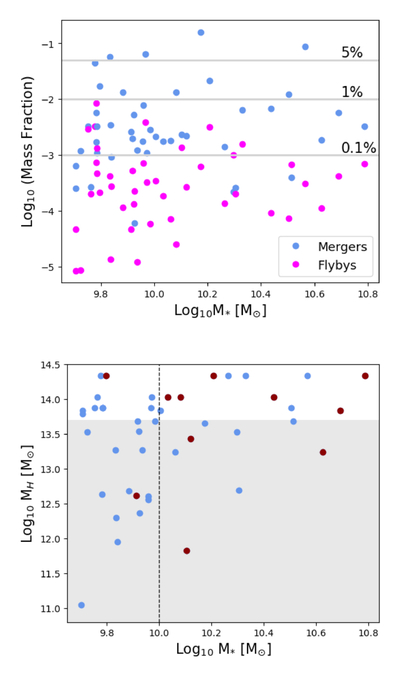
Caption: Figure 1.
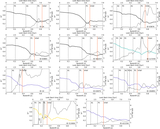
The top panel shows the fraction of stellar mass acquired during mergers (blue dots) and flybys (magenta dots) since z = 1, as a function of the subhalo stellar mass (at z = 0). The three horizontal lines indicate fractions of 5%, 1%, and 0.1% of the total stellar mass in mergers and in flybys. The bottom panel shows the total mass of the halo (group) to which each subhalo belongs, as a function of the stellar mass of the subhalo. The shaded area divides the massive halos (Mhalo > 1013.5 M⊙) from the low-mass halos. The vertical line divides the high-mass subhalos (M* > 1010 M⊙) from the low-mass ones. Those subhalos which belong to our red sample are highlighted in red, see Section 3.2.
Other Images in This Article
Copyright and Terms & Conditions
© 2026. The Author(s). Published by the American Astronomical Society.

