

Image Details
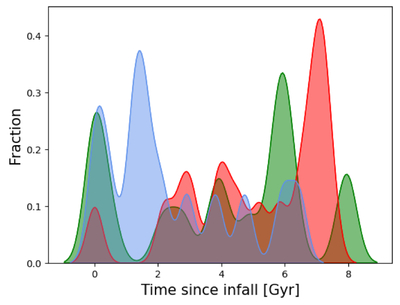
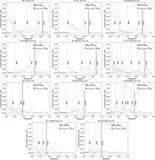
Caption: Figure 4.
Kernel density estimate of the infall times of subhalos in our sample. A Gaussian kernel is adopted, and the distributions are normalized to unit area. Red, green, and blue curves correspond to the red sequence, green valley, and blue subhalo populations, respectively (see Figure 3), following the classification of W. Cui et al. (2024).
Other Images in This Article
Copyright and Terms & Conditions
© 2026. The Author(s). Published by the American Astronomical Society.

Copyright ©
2026 Astronomy Image Explorer. All Rights Reserved.
