

Image Details
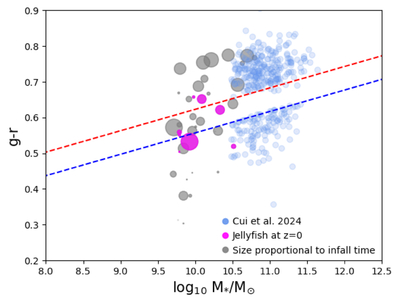
Caption: Figure 3.
The g – r color as a function of stellar mass. The gray circles show our subhalo sample, where the size of the circles is proportional to the time since infall. The blue dots correspond to the massive red spiral galaxies reported in W. Cui et al. (2024). Following the classification given by W. Cui et al. (2024), the galaxies (and subhalos) which appear under the blue dashed line are classified as blue. Those which appear over the red dashed line are classified as red. And those in between the blue and red dashed lines are classified as in the green valley. We plot in magenta those subhalos in our sample that at z = 0 are classified as jellyfish in E. Zinger et al. (2024).
Other Images in This Article
Copyright and Terms & Conditions
© 2026. The Author(s). Published by the American Astronomical Society.

