

Image Details
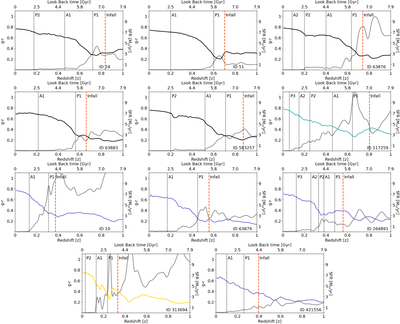
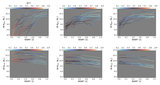
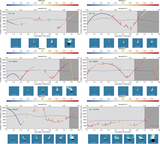
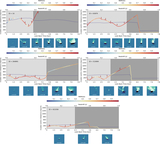
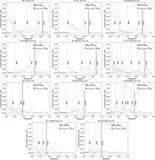
Caption: Figure 6.
Color evolution and star formation history for our subsample of 11 red disk galaxies. The SFR is traced by the light gray curve and indicated on the right y-axis. The g − r color is traced by black, blue, cyan, or yellow curves. The red vertical line shows the infall time. The vertical dashed black lines show the peri- and apo-cluster-centric distances.
Other Images in This Article
Copyright and Terms & Conditions
© 2026. The Author(s). Published by the American Astronomical Society.

Copyright ©
2026 Astronomy Image Explorer. All Rights Reserved.
