

Image Details
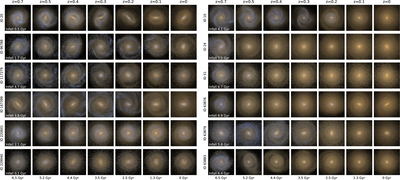
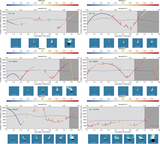
Caption: Figure 2.
Example of face-on SDSS (gri) synthetic images of the evolution of the subhalos from our 45 sample from TNG50. From left to right, the columns show the subhalos at z = 0.7, 0.5, 0.4, 0.3, 0.2, 0.1, and 0. The ID of each subhalo is given (for z = 0) as the y-label in each row. The left set of images correspond to examples of blue subhalos. The right set of images correspond to examples of our red subhalos sample (see Section 3.2).
Other Images in This Article
Copyright and Terms & Conditions
© 2026. The Author(s). Published by the American Astronomical Society.

Copyright ©
2026 Astronomy Image Explorer. All Rights Reserved.
