

Image Details
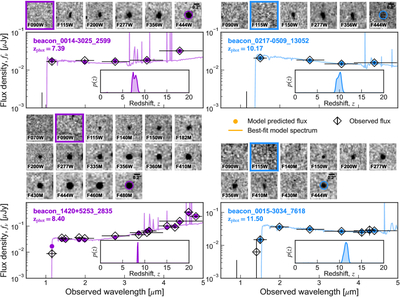
Caption: Figure 5.
Examples of our observed photometry and SED fitting results for two F090W dropouts (purple) and two F115W dropouts (blue). Black open diamonds show the observed photometry in each band with errors, where the uncertainty range on the wavelength axis is determined from the half-power wavelengths of the passband, e.g., the wavelengths at which the transmission falls to 50% of its peak value. The colored curves are the best-fit SEDs from EAZY, while the colored circles indicate the corresponding predicted photometry. The insert panel shows the marginalized redshift posterior distribution, p(z), from the SED fitting. We also show image cutouts for each available filter for the given source, marking the dropout filter with a colored border. The 0﹩\mathop{.}\limits^{{\prime\prime} }﹩16 circular aperture in which fluxes are measured is shown on the F444W cutout.
Other Images in This Article
Copyright and Terms & Conditions
© 2026. The Author(s). Published by the American Astronomical Society.

