

Image Details
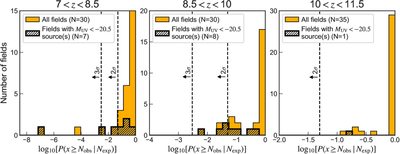
Caption: Figure 10.
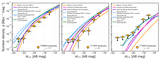
Distributions of the probability of observing Nobs sources or more in a field where ﹩{N}_{{\rm{\exp }}}﹩ sources are expected, measured for, respectively, all fields (orange) and fields hosting at least one bright MUV < − 20.5 source (black, hatched), in three redshift bins: 7 < z < 8.5, 8.5 < z < 10, and 10 < z < 11.5 (left to right panel). The lower the value of ﹩P(N\,\geqslant \,{N}_{{\rm{obs}}}| {N}_{{\rm{\exp }}})﹩, the more unlikely it is that we observed Nobs galaxies, and thus the more statistically significant it is that a field is overdense. The dashed lines mark regions corresponding to Poisson probabilities of ﹩P(N\,\geqslant \,{N}_{{\rm{obs}}}| {N}_{{\rm{\exp }}})\lt 0.003﹩ and <0.05, equivalent to the one-sided 3σ and 2σ tail probabilities of a Gaussian distribution, respectively. Throughout the paper we refer to these thresholds as the 3σ and 2σ overdensity levels.
Other Images in This Article
Copyright and Terms & Conditions
© 2026. The Author(s). Published by the American Astronomical Society.

