

Image Details
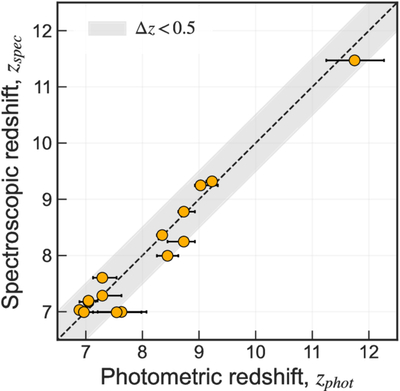
Caption: Figure 4.
Comparison between the photometric redshifts, as estimated from the EAZY SED fit, and the spectroscopic redshifts when available. The orange points represent the median of the EAZY redshift posterior, while the lower and upper errors indicate the 16th and 84th percentiles, respectively. The dashed line indicates the one-to-one relation, while the shaded region shows the Δz < 0.5 margin.
Other Images in This Article
Copyright and Terms & Conditions
© 2026. The Author(s). Published by the American Astronomical Society.

Copyright ©
2026 Astronomy Image Explorer. All Rights Reserved.
