

Image Details
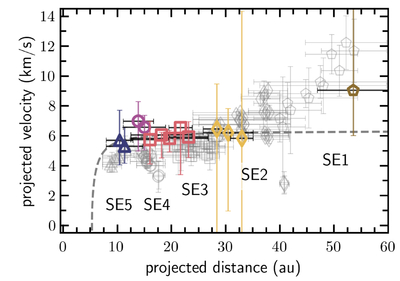
Caption: Figure 9.
Projected velocity versus projected distance of the five clumps in our simulation: SE5’ (triangle), SE4’ (circle), SE3’ (square), SE2’ (diamond), SE1’ (pentagon). The velocities are calculated relative to the positions at 93.16 yr and 99.17 yr (see Figure 8). The black horizontal lines represent the temporal baseline between two epochs for which the projected velocity was evaluated (i.e., the clump’s position at each epoch was at either end of the line). The vertical error bars represent the uncertainty in the positions of the clumps. The projected velocities for the features found in the AU Mic images are shown in gray. The gray dashed line represents the expected particle trajectory based on our MCMC and large-scale simulation. We note that at large projected distances, the clumps become azimuthally extended, and the location of their projected maximum brightness deviates from a single-particle trajectory, consistent with AU Mic observations.
Other Images in This Article
Copyright and Terms & Conditions
© 2026. The Author(s). Published by the American Astronomical Society.

