

Image Details
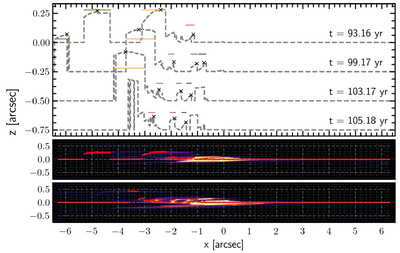
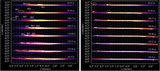
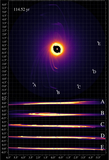
Caption: Figure 8.
The “spine” of the simulated disk at four different time snapshots. This is calculated by finding the pixel above the midplane and on the left side of the disk where the intensity is highest. The blue, purple, pink, yellow, and brown horizontal lines represent the width and uncertainty in the position of the clumps SE5’, SE4’, SE3’, SE2’, and SE1’, respectively. The “x” marks the location of the puff, which is where the pixel with the highest intensity for each puff lies. If no line is present, the clump was not clearly visible in the surface density maps. Two surface density maps with the superimposed spine (red) are shown for reference. Note that the extended disk is not included here so that we could more accurately determine the presence of clumps.
Other Images in This Article
Copyright and Terms & Conditions
© 2026. The Author(s). Published by the American Astronomical Society.

