

Image Details
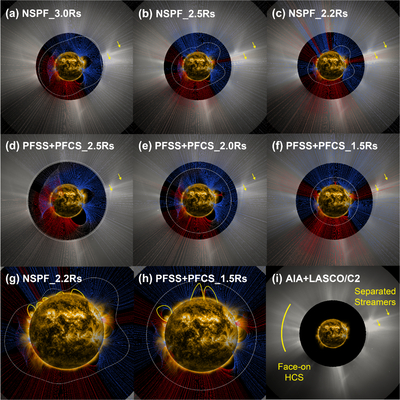
Caption: Figure 3.
Model results compared with coronagraph observations. Panels (a)–(c) show NSPF models with initial source surface radii of 3.0, 2.5, and 2.2 R⊙, respectively. Panels (d)–(f) show PFSS+PFCS models with source surface radii of 2.5, 2.0, and 1.5 R⊙. Panels (g) and (h) show zoomed-in views of panels (c) and (f), respectively, with coronal loops identified visually and overplotted, allowing a more detailed inspection of the coronal magnetic topology. In each panel, background images are from SDO/AIA 171 Å and SOHO/LASCO C2, taken on 2024 March 28 at 02:04 UT. The colors of magnetic field lines indicate their polarities. The silver curves represent the boundary of the source surface projected on the image plane. Panel (i) shows the background images; the yellow arc and arrows highlight the face-on HCS and separated streamers, respectively. The yellow arrows in panels (a)–(f) also refer to the separated streamers.
Other Images in This Article
Copyright and Terms & Conditions
© 2026. The Author(s). Published by the American Astronomical Society.

