

Image Details
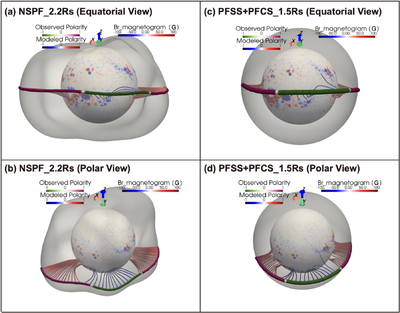
Caption: Figure 6.
Source regions of the observed solar wind. The inner sphere shows the photospheric radial magnetic field distribution; the outer surface is the source surface. The solid curve on the source surface marks solar wind footpoints, colored by observed magnetic polarity (pink: positive; green: negative). Lines connecting the source surface and the photosphere indicate the modeled magnetic field lines (red: positive; blue: negative). The axes widget indicates the orientation, with the Z-axis aligned with the solar rotation axis and the X-axis corresponding to zero Carrington longitude. (a), (b): equatorial and polar view of the NSPF model with an initial source surface radius of 2.2 R⊙. (c), (d): equatorial and polar view of the PFSS+PFCS model with a source surface radius of 1.5 R⊙.
Other Images in This Article
Copyright and Terms & Conditions
© 2026. The Author(s). Published by the American Astronomical Society.

