

Image Details
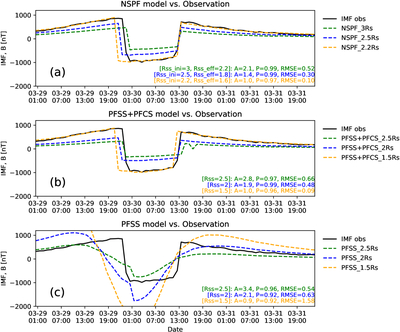
Caption: Figure 5.
Comparison between the modeled IMF and PSP’s in situ measurements. (a) NSPF models vs. observations. (b) PFSS+PFCS models vs. observations. (c) PFSS models vs. observations. In each panel, the black solid line denotes the observed IMF, while the colored dashed lines represent the modeled IMF obtained from models with different (initial) source surface heights, as indicated in the legend. The text annotations indicate the performance metrics for each model.
Other Images in This Article
Copyright and Terms & Conditions
© 2026. The Author(s). Published by the American Astronomical Society.

Copyright ©
2026 Astronomy Image Explorer. All Rights Reserved.
