

Image Details
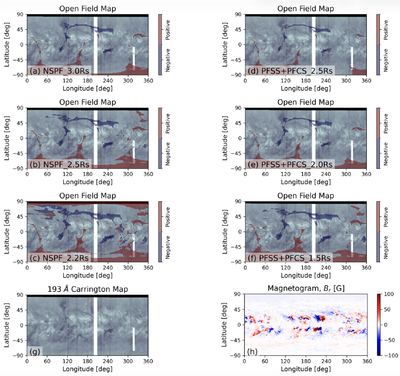
Caption: Figure 4.
Comparison between the modeled open-field maps and the SDO/AIA Carrington map. The background image is taken from the SDO/AIA 193 Å Carrington map dataset (A. Thernisien et al. 2024). Red and blue shading indicate positive and negative open-field regions derived from the models, respectively. Panels (a)–(c) show NSPF models with the initial source surface radii of 3.0, 2.5, and 2.2 R⊙, while panels (d)–(f) show PFSS+PFCS models with source surface radii of 2.5, 2.0, and 1.5 R⊙. Panel (g) shows the bare 193 Å Carrington map. Panel (h) shows the synoptic magnetogram.
Other Images in This Article
Copyright and Terms & Conditions
© 2026. The Author(s). Published by the American Astronomical Society.

Copyright ©
2026 Astronomy Image Explorer. All Rights Reserved.
