

Image Details
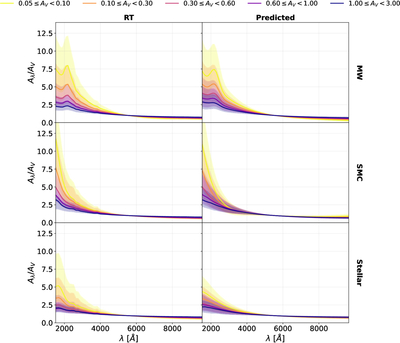
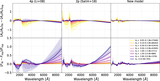
Caption: Figure 14.
Distribution of attenuation curves from radiative transfer (left) or from our learned analytic expressions for the dust attenuation-curve parameters (right) for different dust mixtures, as a function of AV. We plot the median and 68% distribution of values at each wavelength. The distributions are similar for the true and generated curves, for every dust mixture.
Other Images in This Article
Show More
Copyright and Terms & Conditions
© 2026. The Author(s). Published by the American Astronomical Society.

Copyright ©
2026 Astronomy Image Explorer. All Rights Reserved.
